What I think about the NAB chart

by Michael Gable

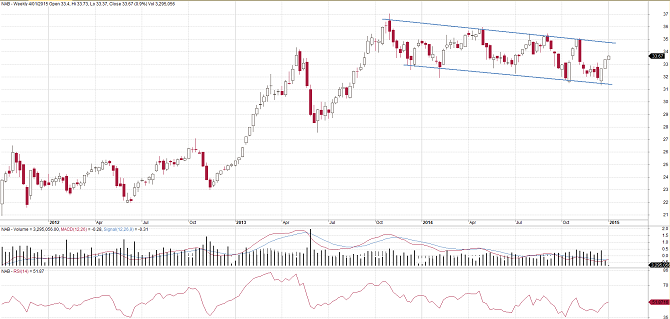
NAB is not our preferred bank, but it is at an attractive level now, as are ANZ and WBC. We can see on this weekly chart here that the stock bounced off the bottom of its recent range. Since peaking 13 months ago, the stock has drifted back to form a flag formation. It is taking a breather before a continuation of the overall uptrend. With interest rates likely to head south again, and investors taking on a more defensive attitude, NAB and the rest of the banks will start to see some buying again. Next year’s forecast yield, grossed up to include franking, sits at nearly 8.5%. Now that NAB is rallying off the bottom of the recent range, we expect a move up towards resistance in the mid $34’s. A breach of that will see NAB push beyond last year’s high.


Disclaimer

Disclaimer: Michael Gable is an Authorised Representative (No. 376892) and Fairmont Equities is a Corporate Authorised Representative (No. 444397) of Novus Capital Limited (AFS Licence No. 238168). The information contained in this report is general information only and is copy write to Fairmont Equities. Fairmont Equities reserves all intellectual property rights. This report should not be interpreted as one that provides personal financial or investment advice. Any examples presented are for illustration purposes only. Past performance is not a reliable indicator of future performance. No person, persons or organisation should invest monies or take action on the reliance of the material contained in this report, but instead should satisfy themselves independently (whether by expert advice or others) of the appropriateness of any such action. Fairmont Equities, it directors and/or officers accept no responsibility for the accuracy, completeness or timeliness of the information contained in the report.
 

Subscribe to our Daily Newsletter?

Would you like to receive our daily news to your inbox?