Why Western Areas (WSA) may fall 20%

by Michael Gable

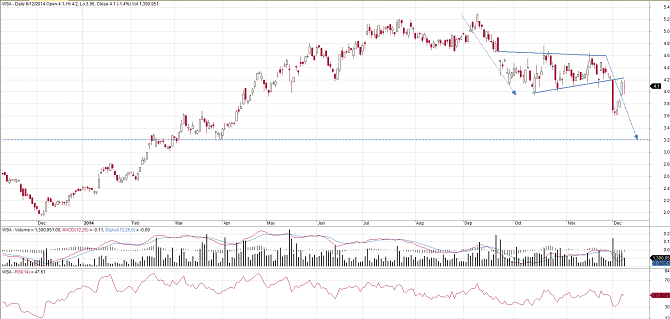
WSA had done well since we tipped it a year ago close to $2. However the stock is now clearly heading lower after having broken the uptrend in September. During the market bounce in October – November, WSA struggled to go higher. As indicated by the solid blue lines on the chart, this now appears to be a continuation pattern. That is, the stock was just taking a rest before resuming the downtrend. This continuation pattern was broken comprehensively a week ago and is now retesting that break. Chances are that WSA fails at this point and continues to head lower. We are targeting some support around $3.20, which is a fall of a little over 20% from current levels.


Disclaimer

Disclaimer: Michael Gable is an Authorised Representative (No. 376892) and Fairmont Equities is a Corporate Authorised Representative (No. 444397) of Novus Capital Limited (AFS Licence No. 238168). The information contained in this report is general information only and is copy write to Fairmont Equities. Fairmont Equities reserves all intellectual property rights. This report should not be interpreted as one that provides personal financial or investment advice. Any examples presented are for illustration purposes only. Past performance is not a reliable indicator of future performance. No person, persons or organisation should invest monies or take action on the reliance of the material contained in this report, but instead should satisfy themselves independently (whether by expert advice or others) of the appropriateness of any such action. Fairmont Equities, it directors and/or officers accept no responsibility for the accuracy, completeness or timeliness of the information contained in the report.
 

Subscribe to our Daily Newsletter?

Would you like to receive our daily news to your inbox?