BHP and RIO have fallen quite dramatically in the last month from their recent highs. Yet when they were pushing higher after their results, most brokers were saying BUY! Not all market professionals are the same. Unfortunately, most brokers always have a buy on BHP and RIO. Yet in the last 12 months we have seen BHP trade in a range between about $31 and $39, and RIO in a range from about $50 to $72. Blindly following the majority of market analysts can be dangerous. Both stocks are down more than 10% from their recent highs. Could the recent sell-off in BHP and RIO have been foreshadowed? Could we have delayed our purchases for a better price, or perhaps even hedged our existing exposure? We identified a couple of “warning signs” a few weeks back and I will very briefly share those with you here to better equip you for next time.
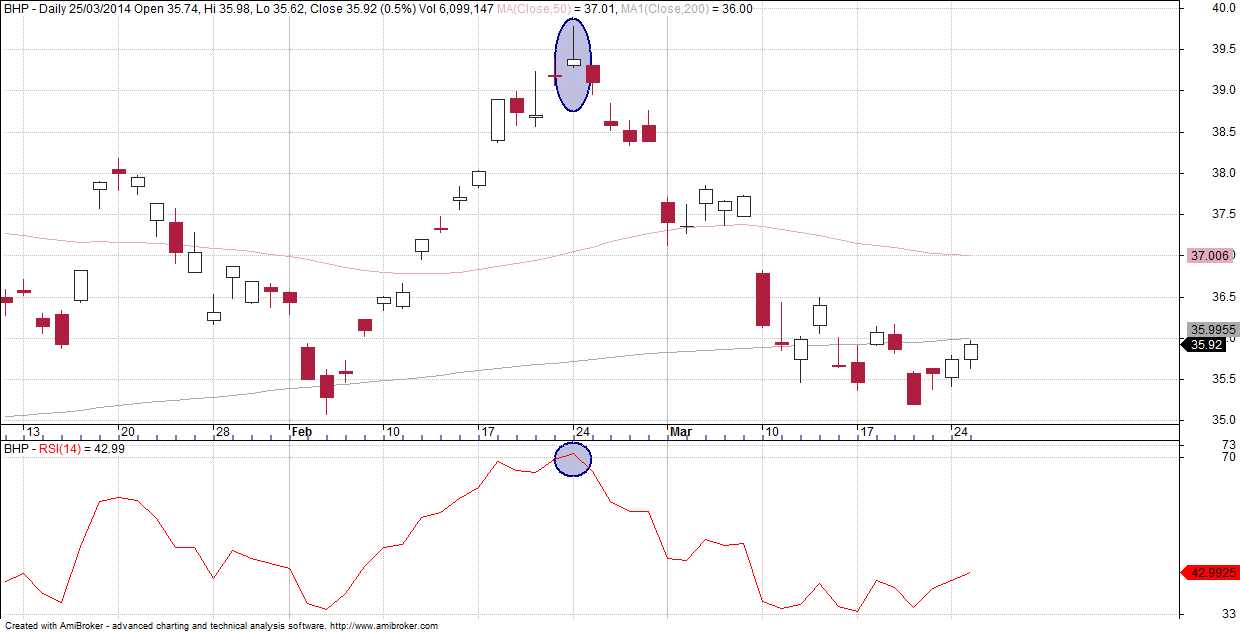
BHP on the daily charts formed what is known as an inverted hammer. On this chart, zoomed in to show just the last few months, we can see the hammer right at the top of the trend (circled). When a stock rallies for a large period of time and then shows this sort of price rejection, it can be indicative of a top. The other signal telling us that this time it may turn here is the Relative Strength Index turning back out of an overbought condition (also circled). The combination of these two signs along with market exuberance was telling us that BHP had reached a top for the time being.
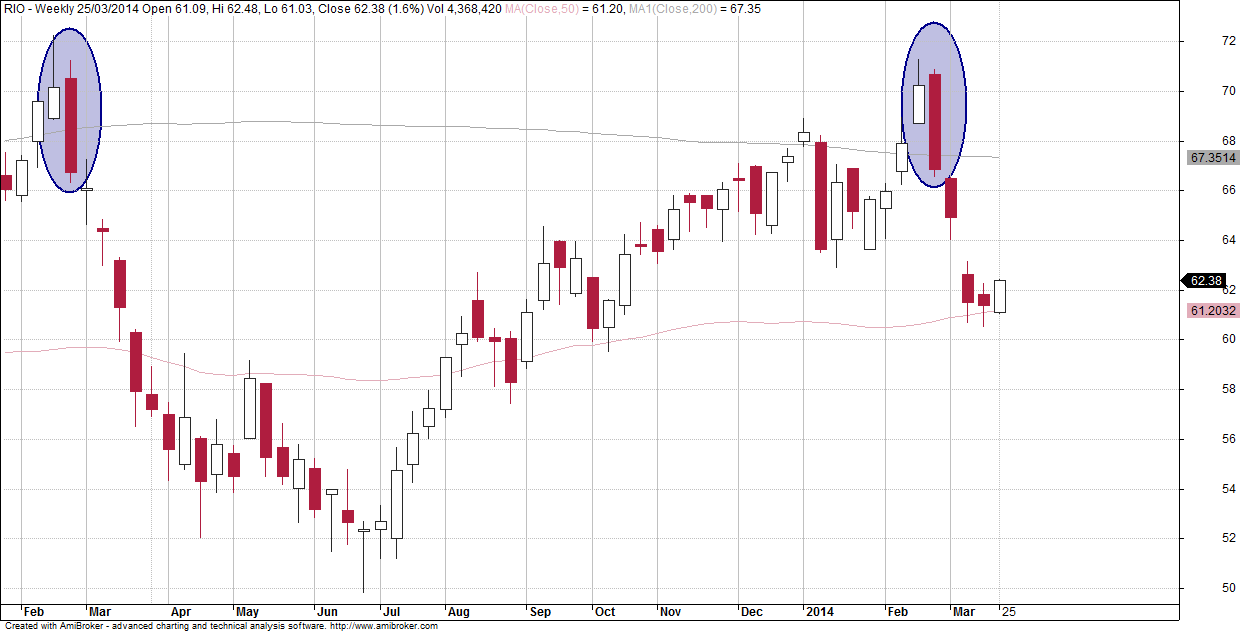
RIO on the weekly chart formed what is known as a bearish engulfing pattern. This is when it starts a new week higher than the close for the previous week, but then undergoes sustained selling to the point where it finishes the week lower than where it started the prior week. I have circled this on the weekly chart. Seeing this happen on a weekly chart can be viewed as a stronger signal that that on the daily chart. You will also notice that RIO made the exact same reversal at the same time last year!
Yes, a bit of hindsight is involved, but we spotted the reversals before most of the damage was done (contact me directly and I’ll send you copies of the reports and let you trial our full client research).
As you can see with RIO, it has made these reversal signals before. So I hope that by sharing my observations with you, you will be able to preserve some of your capital next time these signals appear.