By Dr Shane Oliver, Chief Economist and Head of Investment Strategy at AMP.
Australian home price growth slowed further in April, with price falls in Sydney and Melbourne as rate hikes and uncertainty hit
Key points
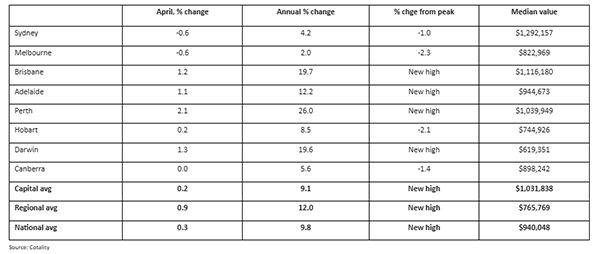
- National average home prices rose just 0.3%mom in April according to Cotality, their slowest pace since January last year. Prices fell in Sydney and Melbourne and while the boom time mid sized cities of Brisbane, Adelaide and Perth remained strong they are seeing slowing growth too.
- The slowdown reflects a combination of rate hikes, buyer uncertainty associated with the Iran War and its impact, and increasing uncertainty around the tax treatment of property going into the Budget along with poor affordability.
- With the RBA likely to hike further, the War likely to boost the cost of living and depress economic activity and the Budget likely to announce an increase in capital gains tax and restrictions on the use of negative gearing a further slowing in the properly market is likely with falls in national average prices looking increasingly likely.
- After 8.6% growth in 2025 we expect national average property price growth this year of around 3%, with the risk on the downside. Average prices could fall over the 2025-26 financial year.
- This is likely to mask a big range though with Brisbane, Adelaide and Perth remaining positive but cooling further and other cities seeing price falls. Units and lower end property are likely to perform better due to the expanded 5% low deposit scheme for first home buyers.
- Low vacancy rates (averaging just 1.6%) contributed to a 0.6%mom rise in rise in April, pushing annual rental growth up to 5.7%yoy, their fastest since October 2024.
Home price growth slowing to a crawl as the property cycle turns down
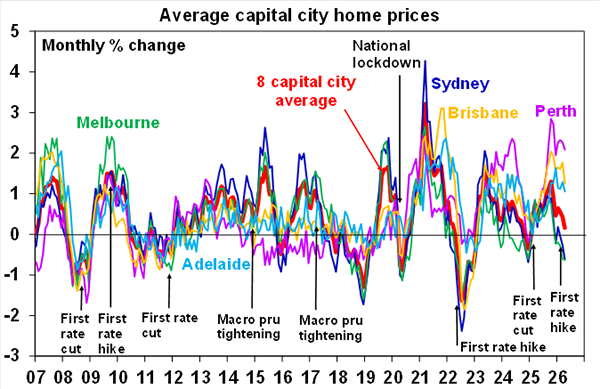
Cotality data shows that national average home prices rose just 0.3%mom in April. This masked a huge divergence though with prices falling in Sydney and Melbourne but ongoing strong gains in the still booming mid-tier cities of Brisbane, Adelaide and Perth and in regional areas, albeit growth there is off its highs too.
Australian dwelling price growth
The broad picture remains one of a continuing slowdown since October as the interest rate cycle turned from cuts to hikes at a time of very poor affordability after prices last year rose to record highs in most cities. The downswing appears to be gaining momentum as the Iran War and its expected flow on to inflation has pushed up expectations for interest rate hikes at the same time as depressing confidence in the outlook for economic activity with increasing worries about unemployment.
Increasing expectations for changes to capital gains tax arrangements – either to reduce the discount or return to the taxation of real capital gains – and to restrict access to negative gearing are likely also impacting as they may reduce investor expectations for the after tax return they can expect which will mean less investor demand and so lower home prices in the short term. (Longer term the changes risk higher prices if investor demand is permanently depressed leading to a lower supply of rental property.)
Working the other way, the boost from the expansion of the 5% low deposit scheme for first home buyers is showing up in relatively stronger growth in lower quartile property prices and in units in most cities. They are also benefitting from poor affordability pushing existing homeowners and investors into lower price points for houses and into units.
Source: Cotality, AMP
The slowdown in Sydney and Melbourne is also evident in a fall in auction clearance rates.
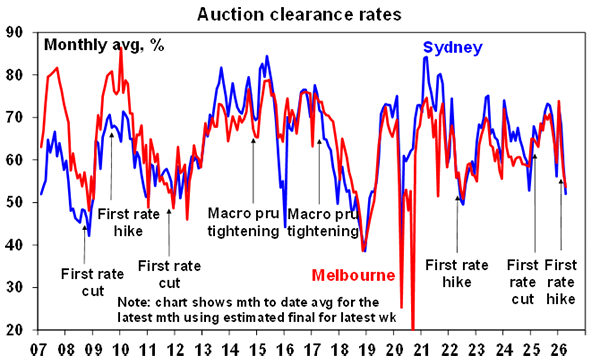
Source: Domain, AMP
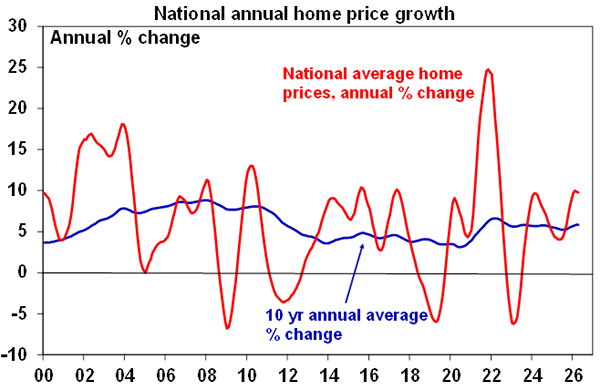
The slowdown in monthly home price growth is now starting to see annual home price growth starting to roll over again too after rising through last year.
As an aside, while there is some talk about a 18-year property cycle soon to drive a slump in home prices there is not much evidence of it in this chart. There was a fall in property prices in 2008, ie 18 years ago, due to rate hikes and the GFC at the time, and 18 years before that in 1990 but they were modest and not much different to the other modest and brief price downturns seen several times over the last few decades.
Source: Cotality, AMP
The housing shortage remains and the 5% deposit scheme will help low end property prices for now…
With slowing population growth – from a peak of 2.5%yoy in September 2023 to 1.6%yoy in September 2025 – and slightly improved housing completions the property market is in better balance on annual basis. But there remains an accumulated housing shortfall – of around 200,000 to 300,000 dwellings – that has built up after several years of very strong population growth. This remains the key driver of upwards pressure on property prices in Australia and poor affordability. And with reports that Federal Treasury is revising upwards its immigration assumptions and rising interest rates likely to put renewed downwards pressure on home building, the housing shortage looks like its going to be with us for a long while yet.

Source: ABS, AMP
The expanded first home buyer 5% deposit scheme and the Help to Buy scheme with 10,000 places a year are also likely to provide further support for the property market. However, this will remain concentrated in lower price points for houses and in units and the bring forward of FHB demand due to the 5% deposit scheme will hit an air pocket at some point, probably next year.
…but we expect a further downturn in the property price cycle
However, despite these sources of upwards pressure on property prices, the property cycle is likely to cool further as rate hikes, the impact of the War and a wind back in property tax concessions along with poor affordability impact.
- With headline inflation rising further to 4.6%yoy in March and underlying inflation remaining well above target at 3.3%yoy even before reflecting much of the second round impact of higher oil prices we expect the RBA to hike rates again at its 5 May meeting taking the cash rate to 4.35%. This will fully reverse last year’s rate cuts and with the RBA likely to retain a hawkish bias another rate hike is possible later this year which will take rates to their highest since 2011. While the relationship is not perfect – as other factors also impact the property market like the surge in immigration and associated housing demand into 2023 and the lag is variable – rate hikes have usually been associated with some softening in property prices or at least in slower property price growth. See the next chart. This is because they reduce how much home buyers can borrow and therefore pay for a home, they weigh on buyer confidence, and they can lead to some rise in distressed sales.
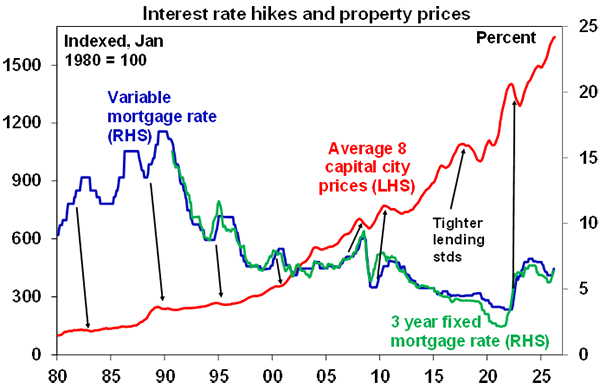
Source: Cotality, ABS, AMP
- Housing affordability has deteriorated further from already very poor levels with the ratio of home prices to wages and incomes being at record levels. This combined with now rising mortgage rates is leading to a widening gap between home prices and what an average buyer can afford to pay for a property. See the next chart. Its already evident in lower priced homes seeing stronger growth than middle and upper priced homes as poor affordability pushes buyers towards lower price points and to units.
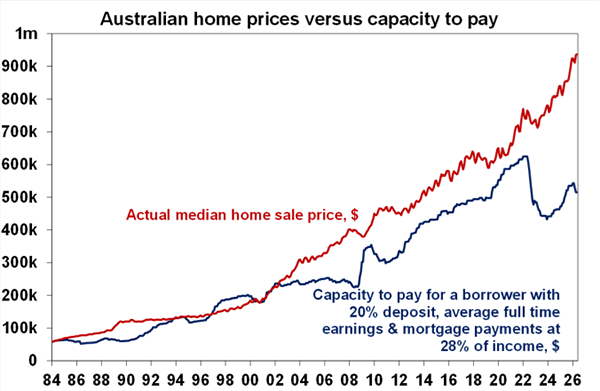
Source: Cotality, ABS, AMP
- With the Budget set to announce a wind back in tax concessions around capital gains tax and negative gearing – with some talk that negative gearing could be restricted to just new home builds – investor demand is likely to fall in the near term as the tax changes will drive a decline in expected after tax returns from property. An element of this was evident in property price falls ahead of the 2019 election although the return of the Coalition at the time headed off any tax changes. The significance of this will depend on what precisely is announced in the Budget. Its worth noting though that if we now move into an era of more constrained home price growth relative to inflation (say 5%pa price growth or less versus 2.5% inflation) investors may not be worse off in terms of capital gains tax payable if a shift back to the Keating model of only taxing real capital gains is announced. Generally speaking, investors benefitted from the 50% discount since 1999, but prior to that they were better off with Keating’s taxation of real capital gains model. It all comes down to the relativity between property price gains and inflation and anything much less than 5% pa annual price gains and inflation of 2.5% or more would see investors better off under the real gains approach. Restrictions to negative gearing, particularly if it’s barred for existing homes could have a much bigger impact though.
- The Iran War has already led to sharp falls in consumer confidence with increased worries about rising unemployment and a fall in perceptions about whether now is a good time to buy a dwelling. At this stage we are only expecting a mild form of stagflation with only slightly higher unemployment. But the longer the Strait of Hormuz remains closed the greater the risk of much higher oil prices and fuel restrictions and hence recession and a significant rise in unemployment. If this occurred it would likely act as a big drag on the property market.
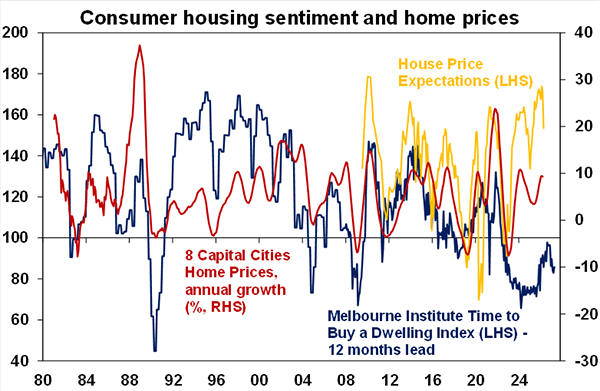
Source: Cotality, Westpac/MI, AMP
Overall, Australian home price growth is likely to soften further over the next 6-12 months with an increasing risk of price falls for national average prices. After 8.6% growth in 2025 we anticipate a slowing in national average home prices growth to around 3% this calendar year with a high risk of a modest fall in prices over the 2025-26 financial year, depending on how high rates go and how long the oil shock lasts.
With FOMO remaining in the boom time cities of Brisbane, Perth and Adelaide they are likely to remain the strongest of the state capitals in the near term. But as their relative affordability and their relative valuations based on price to rent ratios adjusted for inflation continue to deteriorate, they are increasingly vulnerable. Perth still looks okay having had a long slump post the mining boom, but Brisbane and Adelaide are increasingly stretched. For example, in terms of price to rent ratios for houses Brisbane is 57% overvalued and Adelaide is 40% overvalued which is similar to Sydney and the national average is 30% overvalued. In terms of units both Brisbane and Adelaide are 30% or more overvalued compared to Sydney which is just 3.5% overvalued and the national average is 9%. Melbourne houses and units are the least overvalued of the Australian capital cities.
What to watch?
The key things to watch will be interest rates, the Strait of Hormuz and unemployment and Budget changes to property tax. Several more rate hikes, a sharply rising trend in unemployment in response to a worsening oil supply shock due to a longer closure of the Strait of Hormuz and a significant wind back in negative gearing in the Budget could result in significant price falls. On the flip-side a resumption of rate cuts, a quick resolution of the oil shock and only modest changes o property taxes in the Budget could drive a stronger property prices next year.