Dr Shane Oliver, Head of Investment Strategy & Chief Economist at AMP, discusses developments in investment markets over the past week, the coronavirus, economic activity trackers, major global economic events and Australia economic events.Investment markets and key developments over the past week
Recession fears dominated over the last week pushing US, European and Japanese shares down, although Chinese shares (having already had a 35% bear market) rose. Australian shares were little changed with gains in utilities, energy and industrials offset by falls in property, IT and telco shares. Recession fears also pushed down long-term bond yields, oil prices and metal prices with the iron ore price falling about 10% on Friday. And this also pushed the $A down to near $US0.68 as the $US continued to rise.
A rough financial year. Thanks to central bank monetary tightening on the back of the worst inflation break out in decades not helped by the invasion of Ukraine, bond yields surged over the last financial year (resulting in an 8-10% loss for bonds) and shares fell (with Australian shares returning -6.5% and global shares returning around -10%). As a result, balanced growth superannuation funds are estimated to have seen a negative return of around -3 to -5% over the last financial year. No one likes to see their wealth fall but its wise to bear in mind that: periodic share market falls are normal; as a result super funds also have periodic setbacks; but the longer term returns from shares and super are solid with the latter averaging a 7.5%pa return over the last 30 years; switching to cash after a fall will just turn a paper loss into a real loss; and when shares fall they are cheaper offering higher long term return prospects.
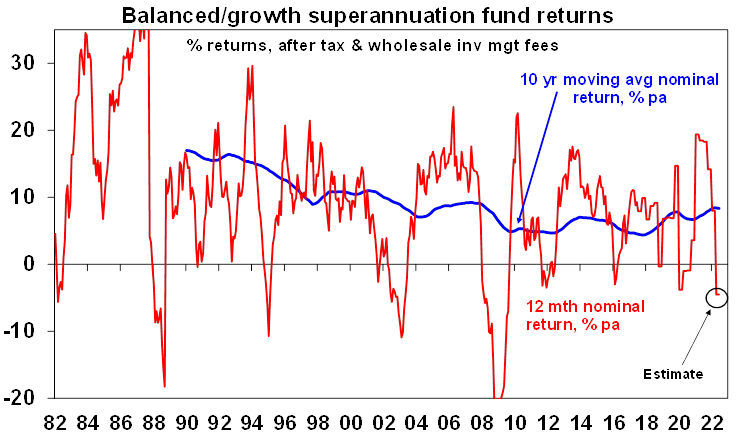
Source: Intech, Morningstar, AMP
More of the same from central bankers who remain hawkish. The key messages from global central bankers (the Fed’s Powell, the ECB’s Lagarde and the BoE’s Bailey at the ECB’s Sintra conference and RBA Governor Lowe in Zurich late last week) were that:
- The low inflation environment is behind us – “I don’t think we are going back to that environment of low inflation…[inflationary] forces have been unleashed as a result of the pandemic [and] geopolitical shock” (Lagarde), “we are now in this new world..with higher inflation and many supply shocks” (Powell).
- There is increasing concern about rising inflation expectations making it harder to get inflation back down without even higher interest rates. For example, Lowe noted that if workers and businesses don’t believe the RBA will credibly get inflation back to target then it will have to impose much higher interest rates.
- They are resolutely focussed on getting inflation back down with recession risks a secondary consideration – “we are committed to and will succeed in getting inflation down to 2%...The process is highly likely to involve some pain, but worse pain would be from failing to address this high inflation and allowing it to become permanent.” Governor Lowe noted that there is just a “narrow path” to control inflation without having a recession
So the bottom line remains that until there is clear evidence inflation is falling central banks will continue tightening, keeping recession risk high. And if a recession eventuates shares likely have more downside as earnings start to fall, because the falls in markets so far mainly reflect a valuation adjustment (ie lower PE’s) in response to higher bond yields. Either way – given the uncertainties it’s still too early to say that shares have bottomed. And share markets have yet to see most of the technical signs coming out of major market bottoms (eg VIX above 40, very high put/call ratios and strong volumes on bounces). The September quarter is traditionally weak for shares which suggests shares could make a bottom around September or October.
Slowing economic data globally and a continuing decline in our Pipeline Inflation Indicator are positive signs in that they suggest pressure may come off central banks later this year enabling them to ease up on the interest rate brake in time to avoid a recession. There is a fair way to go though. And its messy in Europe with a rising risk of a complete stop to Russian gas flows to Germany, and Sweden and Finland joining NATO adding to tensions with Russia. A positive sign may be that various surveys show a US recession in 2022 or 2023 is now pretty much consensus – & often the consensus gets it wrong!
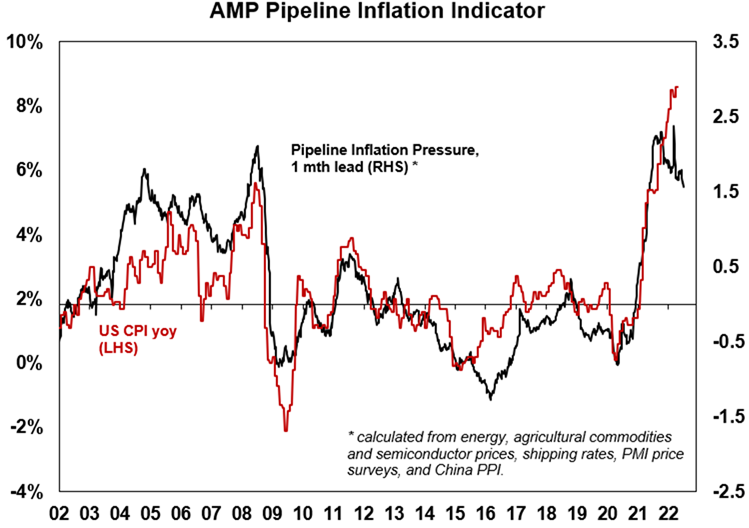
The Inflation Pipeline Indicator is based on commodity prices, shipping rates and PMI price components. Source: Macrobond, AMP
Australian population growth on the mend. Annual population growth rose to 0.5%yoy in the December quarter as net overseas migration rose (by 29,000) for the first time since the pandemic. This is still well below the roughly 60,000 quarterly net immigration that prevailed in the years before the pandemic which was driving 1.5% annual population growth. But its picking up and rising faster than assumed in the March Budget. Queensland saw the strongest population growth last year at 1.4%yoy benefitting from net interstate migration out of Victoria and NSW.
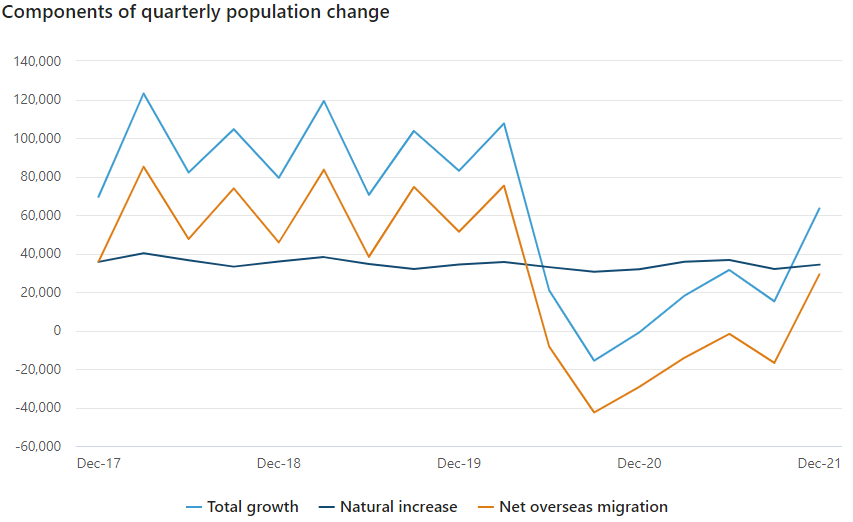
Source: ABS
Based on the Southern Oscillation Index (and weather forecasts for Sydney) La Nina does not appear to be over!
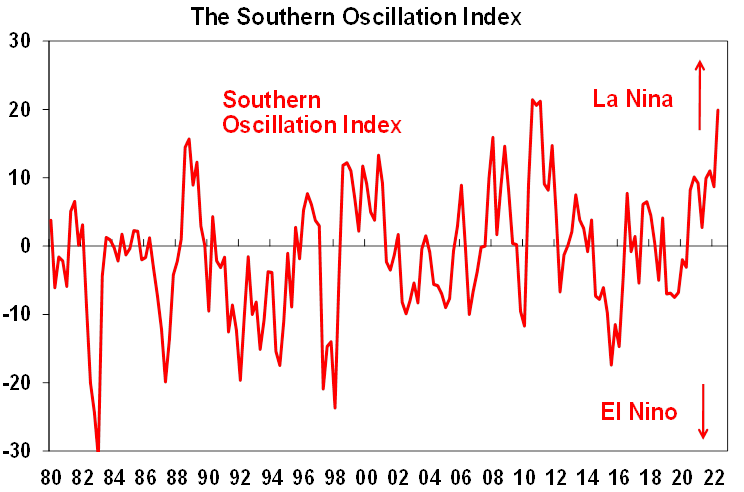
Source; Bureau of Meteorology, AMP
Coronavirus update
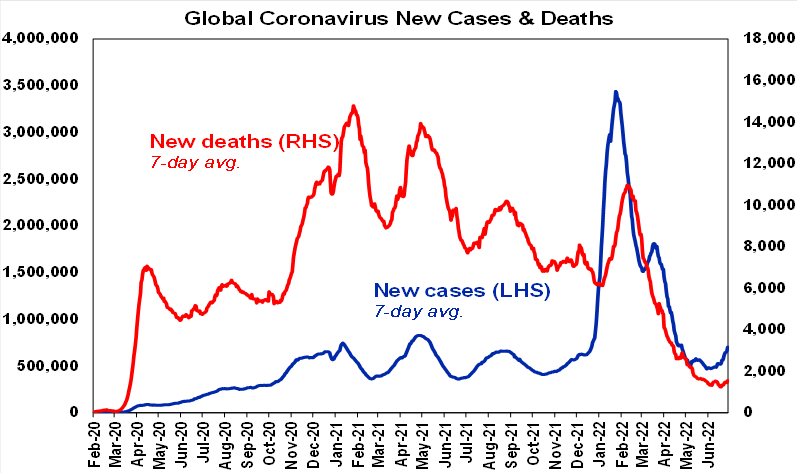
New global Covid cases rose again over the last week – with increases in Europe and South America in particular. They are also edging up again Australia. Fortunately, new cases are remaining low in China.
Source: ourworldindata.org, AMP
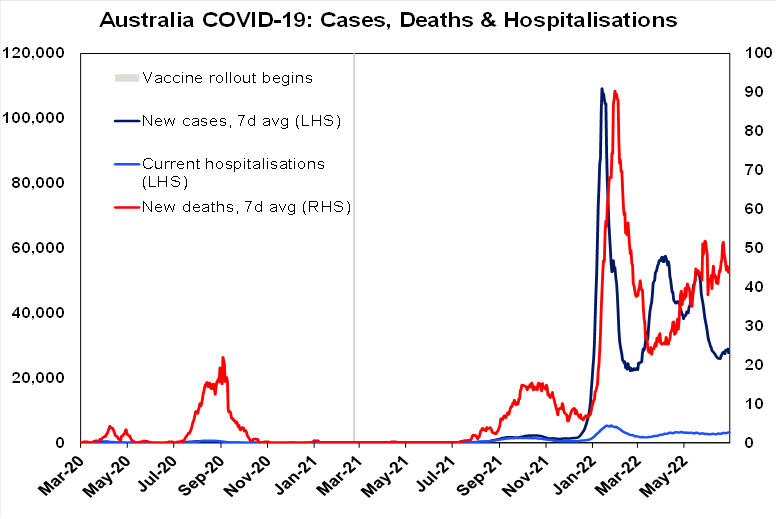
With new cases on the rise in several countries reflecting the more transmissible (but no more harmful) Omicron BA4 and BA5 subvariants, the key is that too many people don’t get infected at once and that hospitalisation and death rates remain relatively subdued. Although these are now distorted a bit (due to the increasing under-reporting of new cases as it becomes endemic), so far so good.
Source: ourworldindata.org, AMP
Economic activity trackers
Our Australian Economic Activity Tracker slipped in the last week with declines in hotel and restaurant bookings and shopper traffic. It remains strong but appears to have stalled since April. Our US Tracker rose slightly but Europe was little change. All are yet to show clear indications of recession.
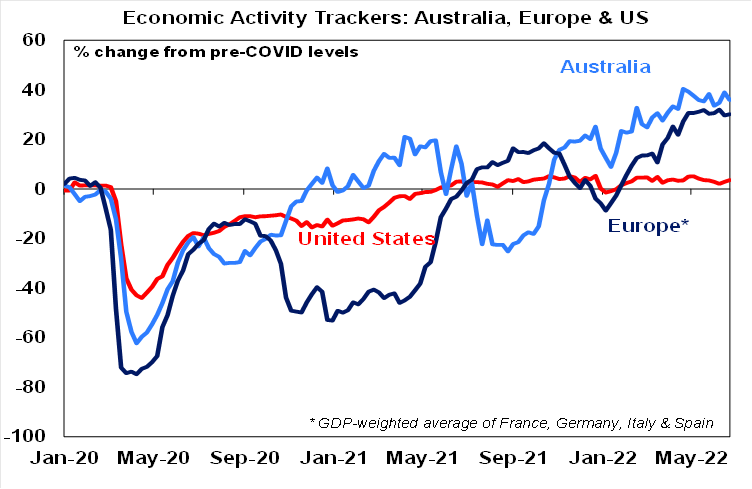
Based on weekly data for eg job ads, restaurant bookings, confidence, mobility, credit & debit card transactions, retail foot traffic, hotel bookings. Source: AMP
Major global economic events and implications
US economic data was a mixed bag. Durable goods orders remain in a decent upwards trend auguring well for business investment and home prices are still rising rapidly. However, real personal spending fell in May and more leading indicators are soft with falls in consumer confidence and regional manufacturing conditions indicators. The Atlanta Fed’s GDPNow has June quarter GDP at -1% which if realised will meet the “two quarters in a row” definition of a recession as March quarter GDP fell too. However, with real final demand, personal income and payrolls remaining strong its unlikely that the NBER will define this as a recession.
US inflation as measured by the core private final consumption deflator fell again in May but its still high at 4.7%yoy and trimmed mean underlying inflation rose further to 4%yoy. So, the fall in May is unlikely to see the Fed ease up on rate hikes. Note that PCE deflator inflation tends to run lower than the CPI because it effectively allows for compositional shifts in consumer spending (as people spend more on falling price products and less on rising price products) and has a lower exposure to shelter.
Eurozone economic sentiment fell again in June but remains well above 2020 pandemic lows – although this is not so for consumer sentiment which is now very weak. Unemployment fell further to 6.6% in May but is likely to be at or close to the low for a while. A 60% cut in Russian gas flows via the Nordstream pipeline to Germany (supposedly due to part supply disruptions) is raising the risk of a complete gas flow shutdown to Germany & a deeper hit to the German economy.
Japanese economic data was mixed with strength in retail sales and okay Tankan business conditions readings but weaker consumer confidence, a sharp fall in industrial production and a rise in unemployment.
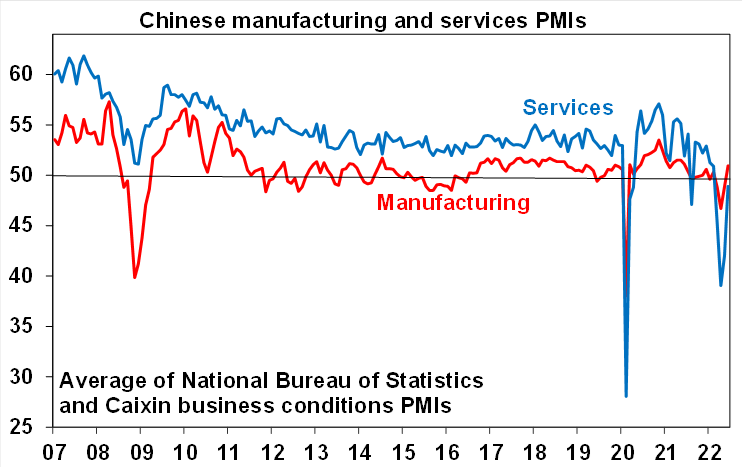
Chinese business conditions PMIs rose sharply again in June as covid restrictions eased driving the official composite PMI to a solid reading of 54.1.
Source: Bloomberg, AMP
Australian economic events and implications
Australian economic data was mostly strong – but is yet to reflect the impact of rising interest rates and cost of living pressures. Job vacancies rose to a record 640,000 in May such that there is now roughly the same number of unemployed as there are vacancies whereas prior to the pandemic it was 3 to 1. This points to a further decline in unemployment ahead but note that this is yet to reflect the impact of rising mortgage rates and cost of living pressures which should become apparent in the months ahead. Rising immigration and backpackers will also help ease labour market tightness.
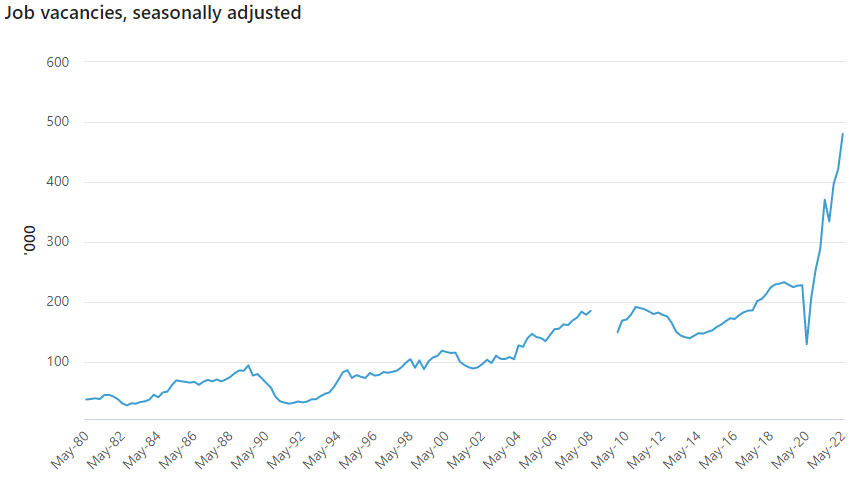
Source: ABS
Retail sales growth rose a stronger than expected 0.9% in May. It was likely boosted by higher prices but its still 15% above its pre-covid trend and is likely to slow ahead on the back of rising rates, a fall in real incomes and an eventual rebalancing back to services. Credit growth was also stronger than expected in May as housing lending remained solid and business lending remained strong. Its likely to slow reflecting the slowdown in housing finance.
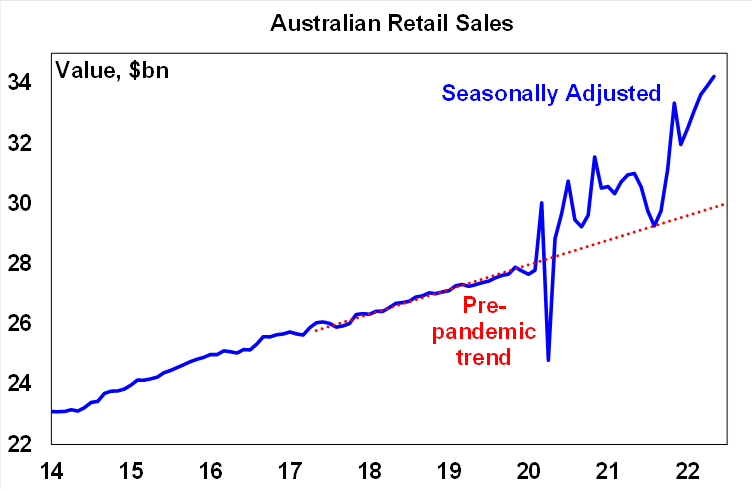
Source: ABS, AMP
Cost of living pressures are highlighted by ongoing high petrol prices which rose another 5% last quarter despite the fuel excise cut. The weekly household petrol bill has risen to a new record high.
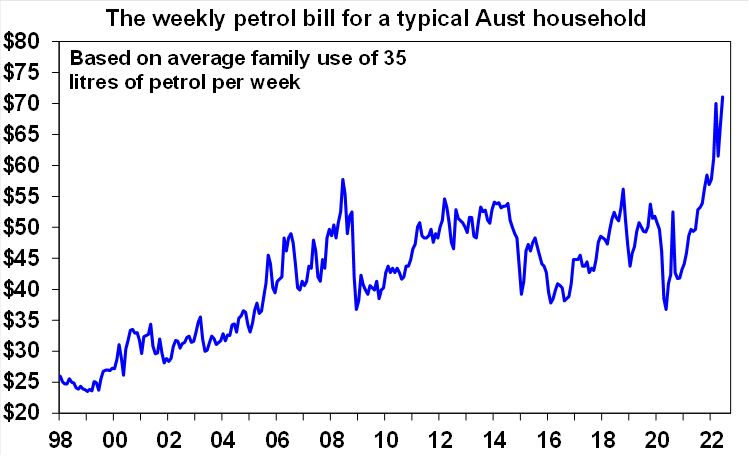
Source: Bloomberg, AMP
Finally, CoreLogic data showed a further acceleration in the property downturn in June, with more to come. National home prices fell -0.6% for their second monthly decline in a row. The key drivers of the falls are poor affordability, rising fixed rates, rising variable rates and poor buyer confidence. And there is likely a lot further to go with more RBA rate hikes ahead. We have now revised our forecast for the top to bottom fall in home prices from 10 to 15% to 15 to 20%. Its now quite likely that rising rates will now reverse a lot of the surge in prices that has occurred since 2020 on the back of record low mortgage rates in several cities including Sydney and Melbourne. The earlier decline in property prices in this cycle compared to past rate hiking cycles by the RBA reflects the surge in fixed rates over the last year (which removed a key leg of the property boom long before the RBA started raising rates) and the greater sensitivity of households to rising rates due to higher debt levels today. Sure, house prices are falling after a massive boom, but it will soon start to weigh on spending and put a brake on how much the RBA can and will need to raise rates by. While money market expectations for the cash rate peak have fallen to 3.7% for mid next year they still imply a property crash and almost certain recession and so remain too hawkish.
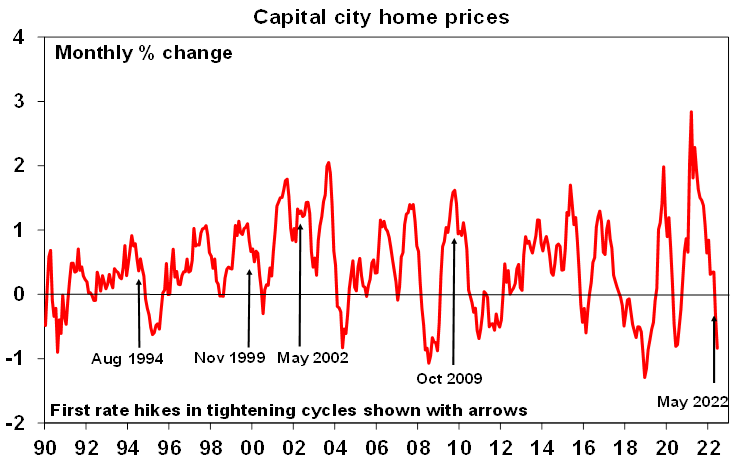
Source: CoreLogic, AMP
What to watch over the next week?
In the US, the focus is likely to be on June jobs data (Friday) which is expected to show a slowing in jobs growth to 250,000, unemployment unchanged at 3.6% and wages growth edging down slightly to 5.1%yoy. Meanwhile the minutes from the Fed’s last meeting (Wednesday) are likely to remain hawkish reiterating the Fed’s “unconditional” commitment to bringing inflation back to target – but probably no more hawkish than has already been factored into markets. Also on Wednesday the ISM services index for June is likely to have slowed a bit further and May job openings data are likely to decline.
Chinese inflation data for June will be released Saturday and are likely to remain benign albeit with a rise in CPI inflation to 2.5%yoy.
In Australia the RBA is expected to increase the cash rate again on Tuesday by another 0.5% taking it to 1.35%. This is already the fastest tightening cycle since 1994 and reflects the surge in inflation and the RBA wanting to underline its commitment to getting inflation back to 2-3% on the grounds that this will help avert the need for even more aggressive rate hikes later. RBA Governor Lowe has indicated that a 0.25% or 0.5% hike is on the table for the July meeting. With interest rates still being too low given the tight jobs market, inflation on its way to 7%yoy and the RBA needing to keep inflation expectations down – particularly after the roughly 5% minimum wage and minimum award wage increases - we expect another 0.5% move. A 0.75% hike as undertaken by the Fed last month is possible but unlikely given that the RBA meets more frequently than the Fed. The RBA will probably hike again by 0.5% in August but thereafter we expect more gradual moves as economic data slows with the cash rate expected to rise to 2.1% by year end with a peak around 2.5% in the first half of next year, ahead of rate cuts in the second half of next year.
On the data front in Australia, expect the Melbourne Institute’s Inflation Gauge for June to show a further rise beyond 4.8%yoy, May building approvals to rise slightly but housing finance to fall (all due Monday) and the trade surplus to fall slightly to $10.2bn (Thursday).
Outlook for investment markets
Shares are likely to see continued short term volatility as central banks continue to tighten to combat high inflation, the war in Ukraine continues and fears of recession remain high. However, we see shares providing reasonable returns on a 12 month horizon as valuations have improved, global growth ultimately picks up again and inflationary pressures ease through next year allowing central banks to ease up on the monetary policy brakes.
With bond yields looking like they may have peaked for now bond returns should start to improve.
Unlisted commercial property may see some weakness in retail and office returns (as online retail activity remains well above pre-covid levels and office occupancy remains well below pre-covid levels). Unlisted infrastructure is expected to see solid returns.
Australian home prices are expected to fall further as poor affordability and rising mortgage rates impact. Expect a 15 to 20% top to bottom fall in prices stretching into second half next year but with a large variation between regions. Sydney and Melbourne prices are already falling aggressively, and most other cities and regions are seeing price gains slow ahead of likely falls.
Cash and bank deposit returns remain low but are improving as RBA cash rate increases flow through.
The $A is likely to remain volatile in the short term as global uncertainties persist. However, a rising trend in the $A is likely over the next 12 months as commodity prices ultimately remain in a super cycle bull market.
Ends
Important note: While every care has been taken in the preparation of this document, AMP Capital Investors Limited (ABN 59 001 777 591, AFSL 232497) and AMP Capital Funds Management Limited (ABN 15 159 557 721, AFSL 426455) make no representations or warranties as to the accuracy or completeness of any statement in it including, without limitation, any forecasts. Past performance is not a reliable indicator of future performance. This document has been prepared for the purpose of providing general information, without taking account of any particular investor’s objectives, financial situation or needs. An investor should, before making any investment decisions, consider the appropriateness of the information in this document, and seek professional advice, having regard to the investor’s objectives, financial situation and needs. This document is solely for the use of the party to whom it is provided.