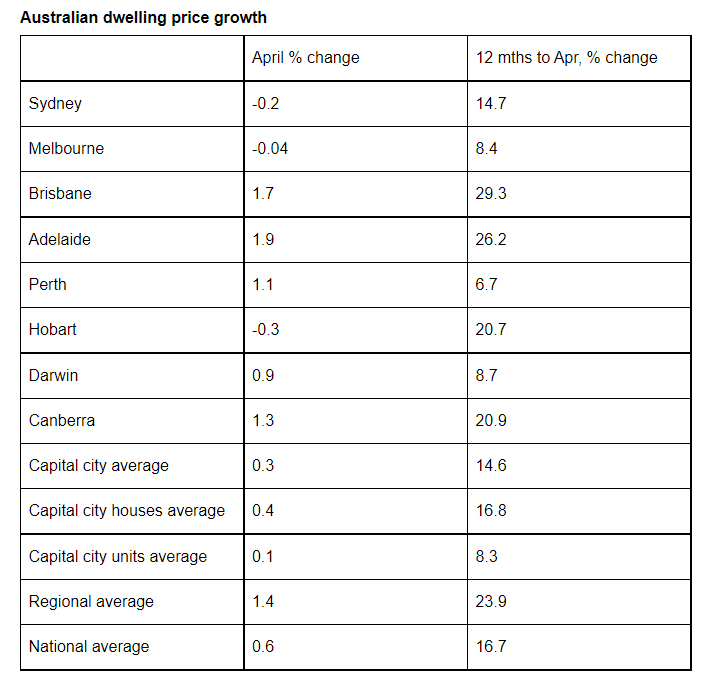
Dr Shane Oliver, Head of Investment Strategy & Chief Economist at AMP, discusses home prices.Australian capital city average dwelling prices rose 0.3% again in April according to CoreLogic, and annual growth slowed to 14.6% year on year.
Including regional dwellings, national dwelling prices rose 0.6% in the month, and they are up 16.7% year on year.
Average capital city prices are now 20.8% above their previous record high in September 2017 and are up 25.5% above their recent low in September 2020.
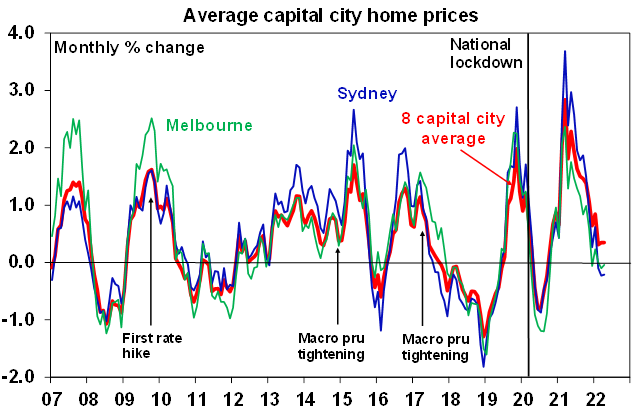
While average capital city home price growth has been stable at 0.3% over the last three months its well down from 2.8% monthly pace seen in March last year, with most cities seeing a loss of monthly momentum compared to last year’s peak.
However, a wide divergence is continuing with Sydney dwelling prices falling for the third month in a row, Melbourne prices down in three of the last five months and Hobart prices starting to fall, but Brisbane and Adelaide price gains still very strong, and Perth and Darwin continuing to pick up.
Regional dwelling price growth also remains very strong at 1.4%mom, as the demand for regional property unleashed by the working from home phenomenon and a greater focus on quality-of-life considerations continues.
Capital city houses are continuing to see stronger price growth than units, although the performance gap is starting to narrow as deteriorating affordability for houses pushes more buyers back into units and unit rents lift in Sydney and Melbourne with the return of students and immigrants.
The property market has slowed sharply
After residential property prices boomed last year on the back of record low mortgage rates, government incentives, recovery from the lockdowns of 2020, a lack of supply and coronavirus driving a switch in consumer spending from services (like holidays) to “goods” including housing, the property market has now slowed down dramatically. See the next chart.
The drivers of the slowdown are: deteriorating affordability with last year’s 22% surge in prices comparing to just a 2.3% rise in wages; a doubling in fixed mortgage rates from around 2% to around 4%; a rise in new listings in Sydney and particularly Melbourne; a rotation in household spending from goods back to services; cost of living pressures making it take longer to save up for deposits and a decline in consumer and home buyer confidence.
The deterioration in affordability has priced many out of the market – both first home buyers and also owner occupiers who were looking to trade up. But the main driver of the slowdown is the surge in fixed mortgage rates – being able to borrow at a fixed rate of 2% or less was a key driver of the boom in prices with fixed rate lending accounting for 40-50% of new lending about a year ago. But with fixed mortgage rates now roughly doubling over the last 12 months combined with an increase in the interest rate serviceability buffer from 2.5% to 3% this has substantially reduced the amount new home buyers can borrow and hence their capacity to pay.
The slowing trend since March last year has been led by Sydney and Melbourne, which are now seeing modest price falls. But while they have lost some momentum, price gains remain very strong in Brisbane and Adelaide as they play catch up to the previous gains in Sydney and Melbourne, with property demand in Brisbane benefitting from strong interstate migration, and these cities seeing less of an affordability constraint and very low listings. Perth is still accelerating helped by its reopening to other states.
Source: CoreLogic, AMP
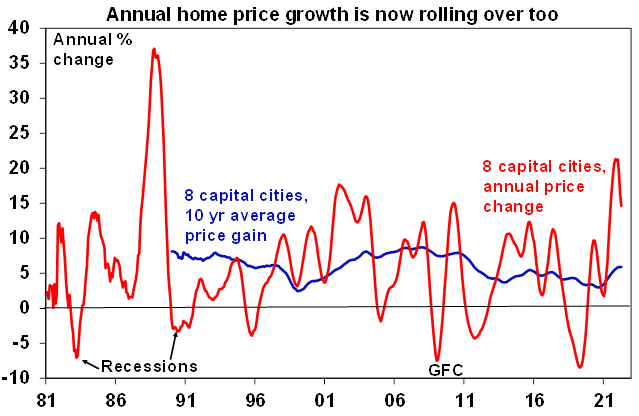
The slowdown in monthly price growth is now seeing annual price growth roll over too. Simple mean reversion after a period of well above 10-year average growth warns of a further slowdown ahead.
Outlook – expect average property prices to fall 10 to 15% into early 2024
We expect national average property prices to peak around mid-year and then enter a cyclical downswing reflecting the combination of: poor affordability pricing more and more home buyers out of the market; rising fixed mortgage rates; the RBA likely to start hiking rates this month (or if not then in June) taking the cash rate to 1.5% by year end which will push variable mortgage rates up by nearly 1.5% by year end; high inflation which is making it even harder to save for a deposit; higher supply in Sydney and Melbourne as a result of vendors seeking to take advantage of high prices; and a rotation in consumer spending back towards services as reopening continues which may reduce housing demand.
The property slowdown is occurring earlier relative to the timing of RBA rate hikes this cycle because of the bigger role ultra-low fixed rate mortgage lending played this time around in driving the boom. Normally fixed rate lending was around 15% of new home lending but, as noted earlier, over much of 2020-21 it was around 40 to 50% as borrowers took advantage of sub 2% fixed mortgage rates. But the surge in fixed rates over the last year has been taking the edge of new home buyer demand well ahead of any move by the RBA and this has further to play out.
The higher than expected surge in inflation in the March quarter has also caused us to bring forward our expected timing for the first RBA rate hike (albeit only from June to May) and raise our expected cash rate for the end of the year from 1% to 1.5%. The faster expected initial rise in variable mortgage rates has in turn caused up to bring forward slightly the timing of the fall in prices.
So after 22% growth in national average home prices last year, average home price growth this year is now expected to be flat (revised down from 1%) and we expect around a 10% decline in average prices in 2023 (revised from a 5 to 10% fall). Top to bottom, the fall in prices into 2024 is still likely to be around 10-15%. But seen in the context of the huge 25% plus surge in prices since their 2020 low this will just take average prices back to the levels of around April last year, so a big rise in negative equity is unlikely.
This is likely to mask a continuing wide divergence though: Sydney and Melbourne already look to have peaked; but laggard cities like Brisbane and Adelaide and possibly Perth and Darwin which are less constrained by poor affordability are likely to be relatively stronger this year with gains likely to persist into the second half of the year, before succumbing to the impact of higher mortgage rates.
The main risks to our forecasts are on the downside and could come from another big coronavirus set back to the economy, a serious deterioration in the Ukrainian war affecting confidence or alternatively faster mortgage rate hikes. Higher than anticipated mortgage rates are the biggest risk as the jobs market has tightened more than expected and inflation is rising much faster than expected with the CPI likely to be up by 5.5% or more over the year to the June quarter.
The main risk on the upside would be a rapid surge in immigration post the Federal election to make up for lost immigrants over the last two years, although this is likely to show up initially in higher rents and then higher prices with a lag. The new round of 50,000 low deposit home loan guarantees for the year ahead, along with 10,000 places in Labor’s “Help to Buy” low deposit/Government equity share scheme if the ALP wins power, will provide some support to the property market but are unlikely to be enough to prevent the unfolding downswing.
The unfortunate aspect about the ALP’s “Help to Buy” plan is that it’s just another scheme that boosts demand rather than fundamentally solves the housing affordability problem with new supply. The key will be whether Labor’s proposed National Housing Supply and Affordability Council leads to real solutions on the supply front – in which case a future government (and hence taxpayers) should make little return or maybe even a loss on the equity contribution under its “Help to Buy” plan.
At present the national average property downswing now starting to unfold looks like just another cyclical downswing but note that the 25-year bull market in capital city property prices is likely to come under pressure in the years ahead as: the 30 year declining trend in inflation and hence mortgage rates which has enabled new buyers to progressively borrow more and more, and hence pay more and more for property is now likely over; and the work from home phenomenon and associated shift to regions may continue to take some pressure off capital city prices.
Ends
Important note: While every care has been taken in the preparation of this document, AMP Capital Investors Limited (ABN 59 001 777 591, AFSL 232497) and AMP Capital Funds Management Limited (ABN 15 159 557 721, AFSL 426455) make no representations or warranties as to the accuracy or completeness of any statement in it including, without limitation, any forecasts. Past performance is not a reliable indicator of future performance. This document has been prepared for the purpose of providing general information, without taking account of any particular investor’s objectives, financial situation or needs. An investor should, before making any investment decisions, consider the appropriateness of the information in this document, and seek professional advice, having regard to the investor’s objectives, financial situation and needs. This document is solely for the use of the party to whom it is provided.