BHP Group has been been developing and contributing to industry, communities and economies around the world since 1851.
The company’s history began in Broken Hill, in New South Wales in a silver, lead and zinc mine. From there the company engaged in the discovery, development, production and marketing of a range of other natural resources including iron ore, copper, oil and gas and diamonds, along with the silver, lead and zinc. BHP also became a market leader in value-added flat steel products.
The merger with Billiton brought more rich history to the company. Tracing its origins back to the 1850s on a little-known island in Indonesia, Billiton (Belitung) island. Billiton became a world leader in the resources sector. Growing from a small tin mine to a major producer of aluminium and alumina, chrome and manganese ores and alloys, steaming coal, nickel and titanium minerals with a substantial copper portfolio.
The company now prides itself on products that are deemed essential for global economic growth and many are key to the energy transition, to a lower carbon world. These include copper, iron ore, nickel, metallurgical coal, potash and petroleum.

The sweeping upward path for BHP (ASX: BHP $37.83) has seen the price rise from 26c in 1974 to a recent peak in July this year at $54.55. From the early 1970s the price has exhibited a characteristic style of movements which have seen the price move up strongly to a momentum exhaustion point where it would pause and then decline to support before retackling the stalling level, oscillating around it, before breaking higher. On the long-term chart these movements have been highlighted in the 70-80s, in 1995 and 2000 and then in 2008-11 and earlier this year.
As the upward trend has progressed each action has taken longer to complete. We find that the action which began in 2008 continues to hold influence over the price with the $50 zone remaining a barrier. However, the unsustained penetration to $54.55 in July is reminiscent of the price action experienced in the first quarter of 2000, where the price pushed through the barrier and then pulled back to oscillate around it before forging higher in 2001 and 2002.

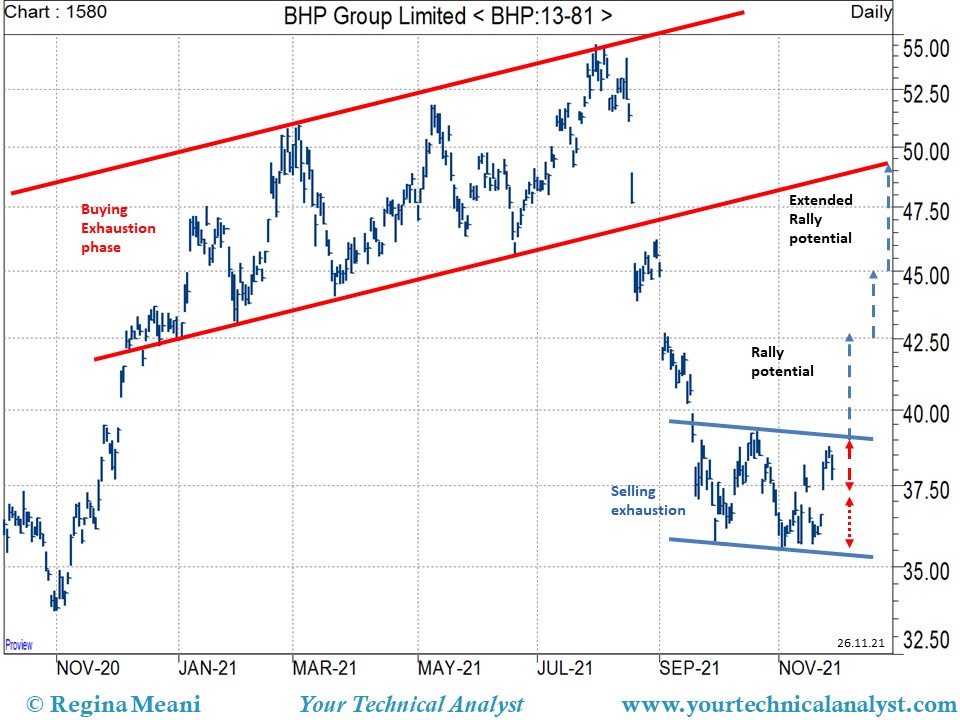
The current price action has declined from the $54.44 peak to seek support in the $35.50-70 area. The price has held the support from 29 September and is exhibiting selling exhaustion. This bodes well for a rally beyond the phase and is likely to provide trading opportunities ahead of a more constructive rebalancing of the upward path.
Over the near term, a price rise through $39.30 would indicate a rally towards $42.50 and possibly towards $45. A failure to breakaway would suggest more activity in the $35.30 to $39 area with a risk that a fall through $35 triggers another decline within the rebalancing phase towards $33 and possibly lower to trend support around $30.
Once the upward path resumes through the peak zone the price would be on track for significantly higher prices.
 Gold at the Crossroads - update from 15 November 2021
Failure at the barrier line and break in the near-term uptrend trigged a “close out the buy position” from the Tandem Trading Method on 18 November and was followed by a sell signal in the next trading session.
