Market analyst Regina Meani discusses Volpara Health Technologies (ASX:VHT).
Volpara Health Technologies’ origins go back to the founding CEO Ralph Highnam’s breakthrough research in medical physics and artificial intelligence at the University of Oxford. Headquarters were set up in Wellington NZ in 2009 where Highnam decided to apply the findings from his research to breast imaging.
Since then, Volpara (ASX:VHT $1.26) has seen tremendous growth, with its team quadrupling in size, and opening offices in Boston, Massachusetts and Seattle, Washington, USA. The expansion has allowed many more customers, especially across North America, Australia, and New Zealand, to provide personalized screening experiences to patients. The Volpara Breast Health Platform is now the most scientifically validated software platform in the breast health industry. The company’s scope now includes lung cancer screening as they continue their mission with an abiding dedication to helping save families from cancer.
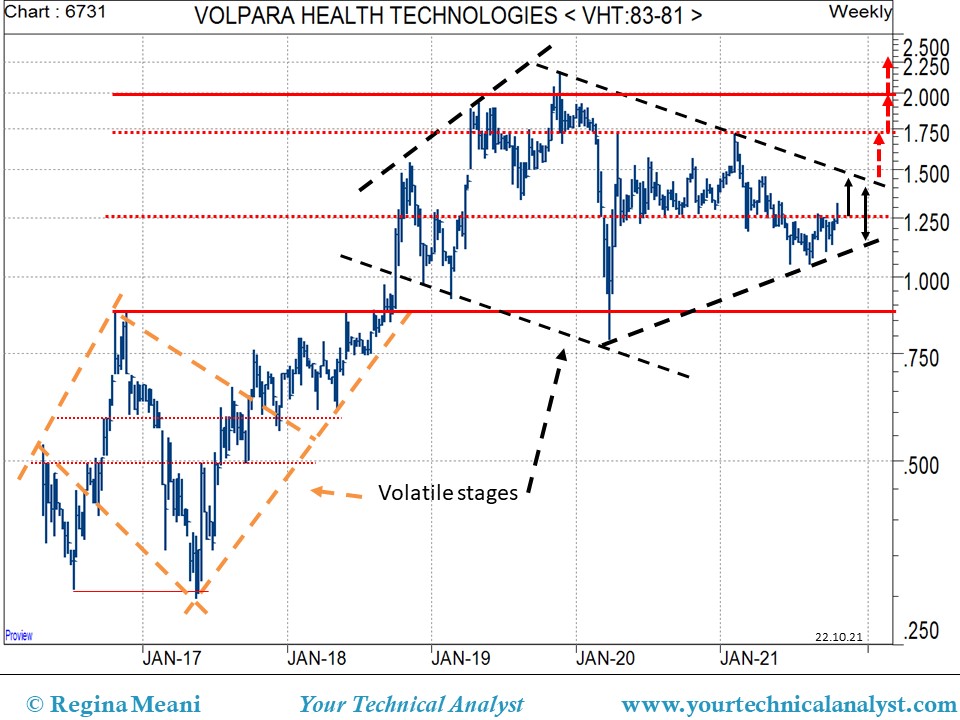
The share price for Volpara has experienced two broad phases of volatility. The first occurred between mid-2016 and mid 2018 where the price ranged between 30c and 87.4c. In early September 2018 the price confirmed the breakaway from the phase and launched higher in two main tranches which formed the beginning of the second stage of volatility. Initially the price surged to $1.54 where overbought momentum produced a substantial pullback to around $1.00 before swinging into the next tranche higher taking the price to $1.93 by early May 2019. After a pause the price pushed higher to reach through $2.00 in late 2019 but the action proved unsustainable as momentum diverged. The price plunged to a low and pivotal turning point at 79c in March 2020, with the reaction spurring a strong recovery to $1.72 within a few weeks. Resistance drawn back to late 2018 halted the advance and saw the price enter a sideways range between $1.22 and $1.57 until early this year when the price made another attempt at the $1.72 barrier. Deflected again, the downward action formed part of the volatility of the phase with the price dropping through the $1.22 level to seek support closer to the previous zone around $1.00.
Producing a double turning point at $1.05 in late June and early August the price has rallied and consolidated, finding some resistance around $1.32. Further consolidation may be required in the $1.19-$1.33 area before breaking higher to test barriers in the $1.40-50 zone. A breakaway through this zone would indicate an end to the second stage of volatility with the potential to test the $1.72 resistance and then beyond to test the peak area around $2.00 and potentially much higher.
The risk to this scenario would be a fall through $1.19 followed by a drop below $1.00.
Ends