Having begun its life as a building society, the Bank of Queensland (ASX: BOQ $9.52) is one of the oldest financial institutions in Queensland. It has over 250 branches throughout Australia, including corporate and owner managed.
The share price travelled sideways from the late ‘90s until early 2003 when it moved outside the sideways parameters and began trekking higher until it reached a peak at $17.90 in November 2007. A top formed and the price fell into decline, falling rapidly until it found support and a turning point at $5.78 in March 2009. The rebound was equally rapid with the price regaining more than half of the lost ground but the action became unsustainable as it moved into the previous top zone. The price became volatile underneath the resistance area but was not able to hold ground with the downward pressure forcing the price back into decline for a retest of the $5.75-6.00 area support.
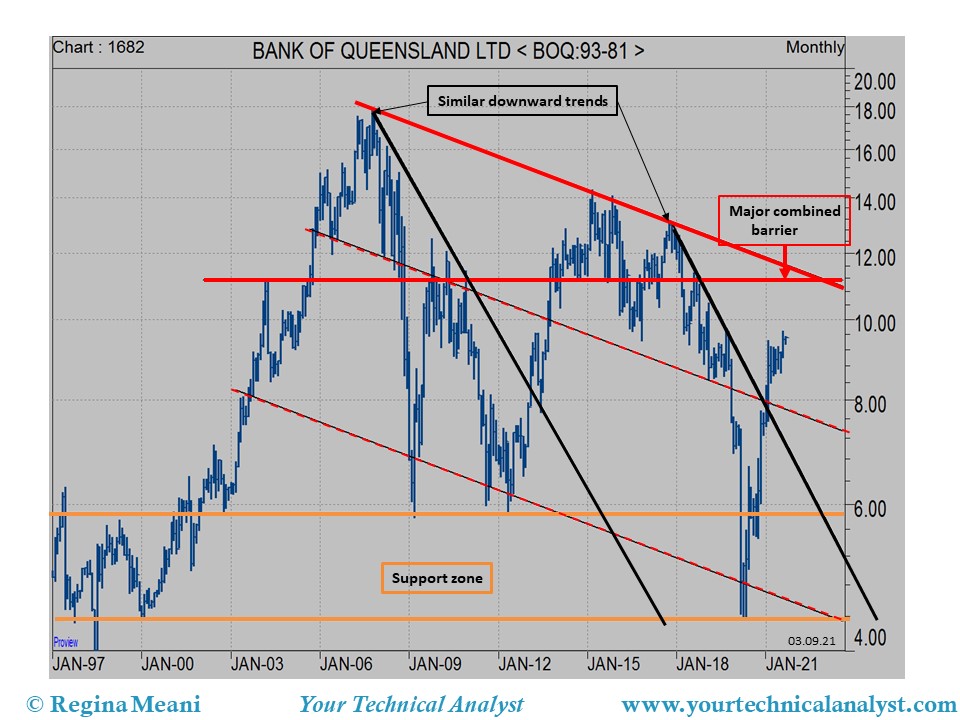
The support held through August 2011 through until May 2012 with the phase developing a reversal. The action was completed early in 2013 spurring another strong upswing in prices for the stock. The uptrend peaked in March 2015 at $14.30 in response to waning momentum in the face of the resistance from the previous peak zone. Following the topping out process the price fell into a similar decline to that experienced from the 2007 peak.
Between March and May 2020, the price reached a low and produced a triple turning point at $4.38-43 to build a reversal phase and trigger the next upswing in price. In January/February this year the price broke through a combination of barriers drawn through the top actions and from the downward trend line. Since then, the price has continued to push higher, completing a triangular consolidation on 6 August to then rise to test a parallel of resistance at $9.68. This line of resistance is running higher over time and may align around $9.75 in the next week or so. A break up through this level would find some resistance around $10.00 but with the potential to head towards $10.50 with a more serious barrier, drawn from the 2007 peak, around $11.50. A break away through this level would signal a major shift for the stock and the possibility of much higher prices.
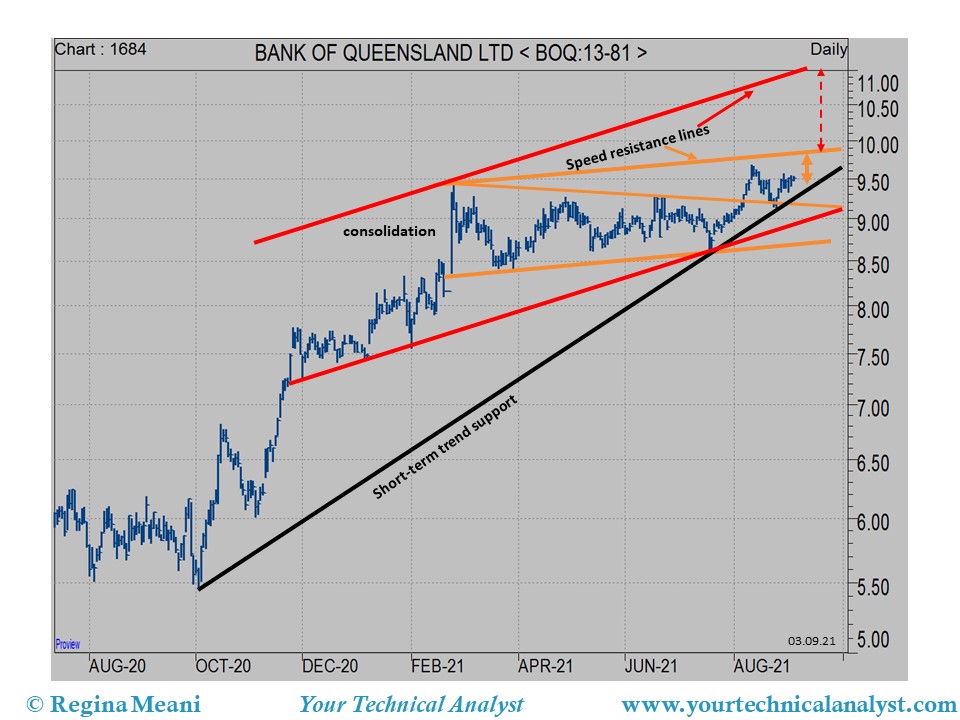
At this stage the momentum readings are mixed but leaning toward the more positive side in support of the current upward trend. Over the near-term, traders should focus on the approach to the barriers and on the short-term trend support located around $9.30 and then more importantly at $9.10. A penetration of these levels could see a deeper and more volatile pullback into the $8.00-9.00 range.
Ends