Below is an extract from our recent client research report on GUD.
Fundamental View
With the stock price having been de-rated, and now trading on a 1-year forward P/E multiple of 11.2x, the market is taking a view that achieving profit growth without the benefit of cost cutting initiatives in recent years is going to be difficult and that achieving sales growth against further falls in the A$ (vs US$) is going to be challenging.
Accordingly, with GUD having executed well on profit improvement initiatives to date, the key question for investors is whether the Company can generate profit improvement on the back of revenue improvement over the short-to-medium term at least.
Indeed, the Company itself has acknowledged that profit growth now needs to come from revenue growth. Nonetheless, the profit improvement program is continuing, even though “most of the easy wins have been banked”. As an example, Dexion delivered cost savings from the closure of the Kings Park facility that were well below expectations due to timing issues (more cost benefits are expected with a full year effect in FY16).
Notably, GUD generated sales growth across all divisions in 2H15, against the headwind of a ~5% fall in the A$ (vs the US$) during this period. In the current half-year period, the A$/US$ exchange rate is down by ~8.5%, so while there may be an impact on sales in 1H16 as a result of the further fall in the A$/US$, we contend that the impact may be limited to the current half-year period, assuming no significant further fall in the exchange rate from the current level.
A further point underpinning our POSITIVE view is that the acquisition of Brown & Watson International in May 2015 (which is still in the early stages of integration) has contributed to an improved quality in the earnings profile. Post the BWI acquisition, GUD will have greater than 65% EBIT exposure to the automotive aftermarket industry, although this growth is expected to start to ramp up in late FY16. Importantly, the BWI acquisition has taken the pressure off cost cutting to generate profit growth.
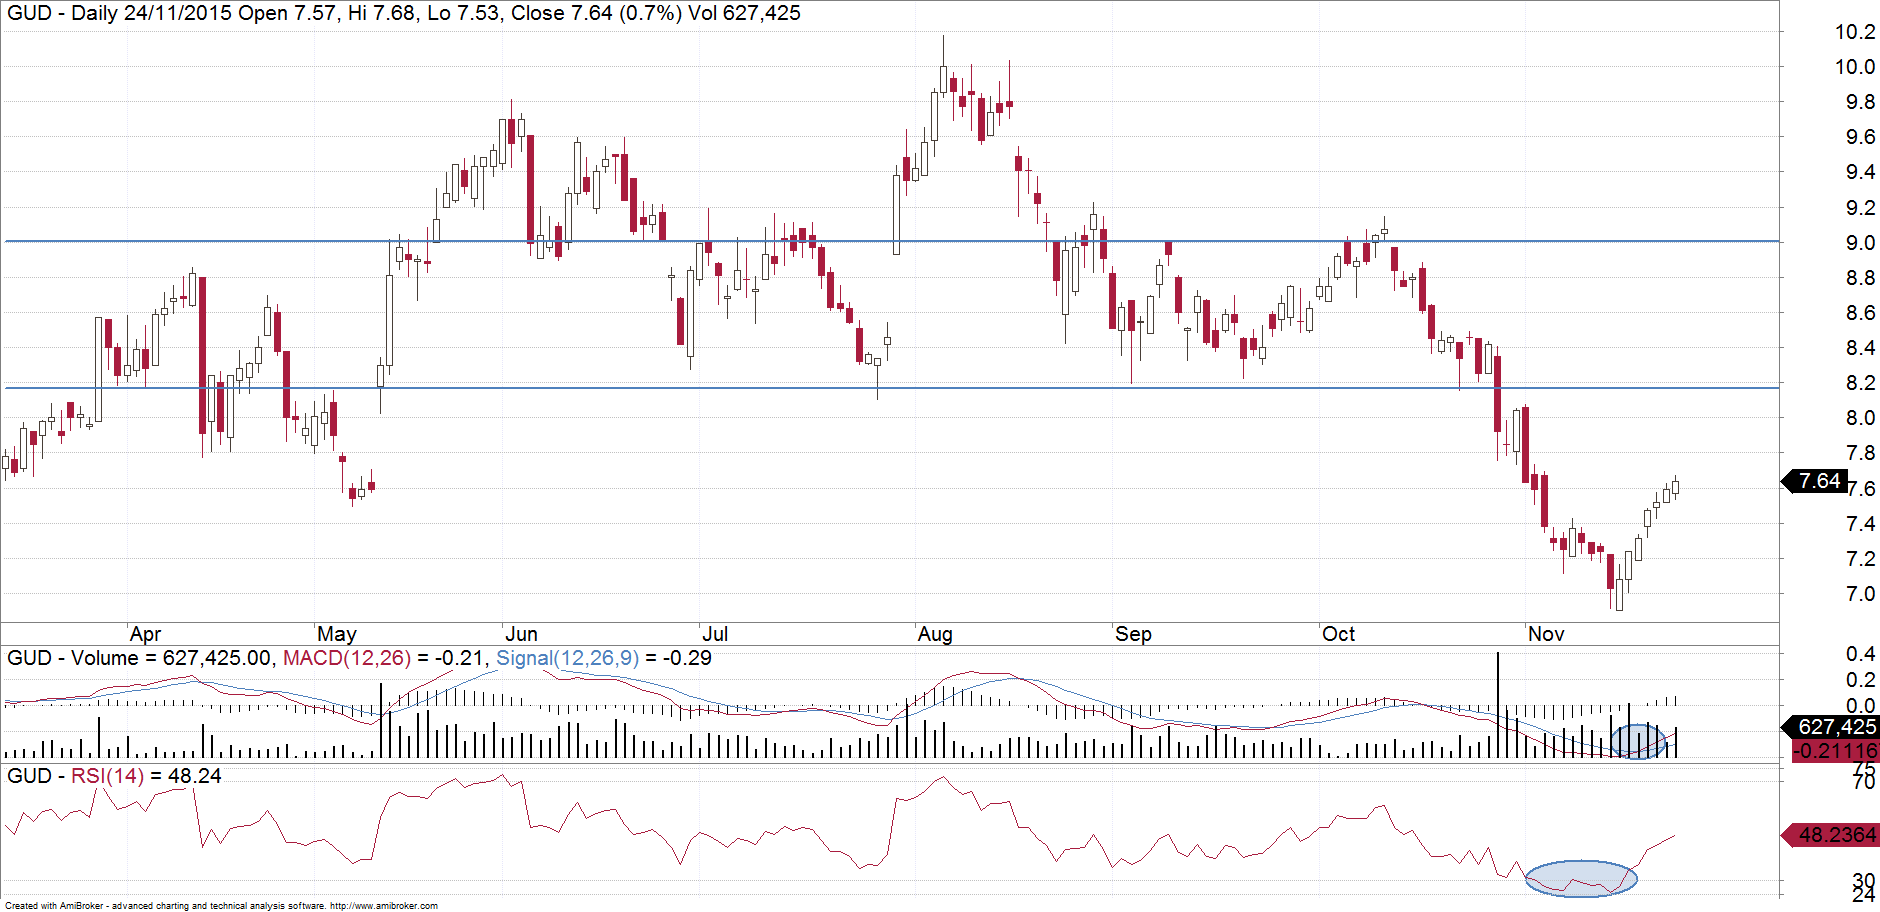
Technical View
GUD had pulled back particularly sharply during October when the broader market was heading higher. It has caused it to become oversold, triggering a buy signal on the RSI (circled). We have also noticed that the pullback from the August high has been done in a 3 wave "abc" where wave "a" is equal to wave "c". So this is likely a countertrend move against the longer term uptrend. With the recent market-beating performance, there is a good chance that GUD can bounce here, at least to the mid $8's.