A month ago I shared with you our model portfolio - a portfolio that was designed to beat the market. Today I want to share with you what we are currently holding, and analyse what is working and what isn't. That way you can hopefully gain some insights that will help you with your own investing.
Thursday the 21
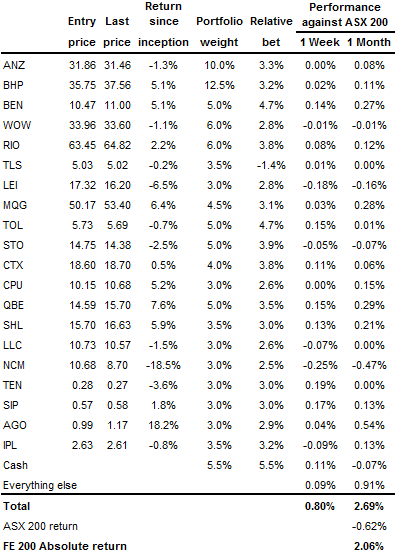
st November was the one-month anniversary of the FE 200 model portfolio. It has been a great month for the portfolio – generating returns 2.5% in excess of the ASX 200! This is a result of investing in good quality companies with earnings prospects greater than many other stocks.
One limitation of the FE200 is that we can only hold 20 stocks. This means our portfolio is much more concentrated than the basket of stocks that make the ASX 200 index. While it comes with risks, good stock picking means there is immense opportunity to perform much better than the index ever could. This was on display in our portfolio, with only a few names most contributing to our outperformance.
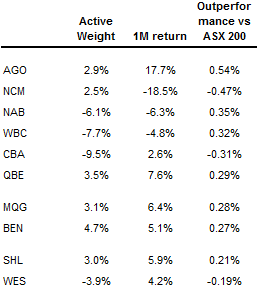
For those who track our portfolio each week, the first thing noticed is the effect that NAB, WBC, CBA and WES have on our portfolio. This performance is due to our non-ownership of these names! In the case of NAB, not owning it prevented us from losing 6.3% over the month. Adjusted for its weight in the index, this meant that we have returned 0.35% more than the ASX 200 simply by staying away from NAB! Capturing the ‘opportunity cost’ this way is a great way of accounting for how well we pick stocks.
Another observation is that, of these ten names, most are banks. Our strategy of owning ANZ and BEN has paid off – as NAB and WBC have performed poorly, our bank strategy earned the portfolio 0.71% of excess return in a month. Combined with Macquarie Bank, our portfolio has outperformed by 1%.
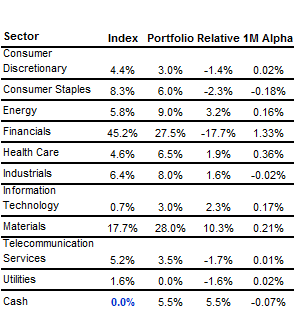
Looking at our performance by sector, we can see that our avoidance of financial stocks has helped us immensely, with at least 1.3% of outperformance attributable. Further outperformance has come from our exposures in the mining and oil & gas sector and overweight position in the healthcare sector. From a sector perspective, we fared poorly in consumer staples, primarily due to our preference of Woolworths over Wesfarmers.