Today we have launched a model portfolio and I wanted to share that with you today. That way you can see how it looks initially and hopefully get a feel for what stocks we currently like and what sector weightings we believe will enable you to beat the market.
For simplicity, we have made the inception date as Monday 21 October 2013, and have taken the prices on the open. With the market at 5 year highs and plenty of stocks fully valued, we have obviously launched it at a challenging time to beat the market. So we look forward to looking back on the performance. Our initial cash holding also gives us the ability to make additional purchases on any market pullback.
Below are our top picks concentrated together into a portfolio, which is compared with the ASX 200 index. We believe, in recommending stocks, they at least outperform the index. In the table below, we have identified the ‘relative bet’ we have on these stocks. That is, if our portfolio is compared to the index, we have more exposure to each of these stocks (with the exception of Telstra, where we are less exposed than the index). This means that we will benefit as these shares perform better than the ASX 200. Conversely, we will fare poorly if the index performs better than these stocks. Telstra, as an ‘underweight’, finds the reverse true. We benefit if Telstra performs worse than the benchmark. It doesn’t mean we don’t like it, but it tends to mean we are positive on the market in general.
Table 1 Fairmont Equities 'FE200' Model portfolio
|
Ticker |
Name |
Sector |
Index weight |
Portfolio weight |
Relative bet |
|
ANZ |
Aust & NZ Bank Grp |
Financials |
6.71% |
10.00% |
3.29% |
|
BHP |
BHP Billiton Ltd |
Materials |
8.81% |
10.00% |
1.19% |
|
BEN |
Bendigo & Adelaide |
Financials |
0.33% |
5.00% |
4.67% |
|
WOW |
Woolworths Ltd |
Consumer Staples |
3.26% |
6.00% |
2.74% |
|
RIO |
Rio Tinto Limited |
Materials |
2.12% |
5.00% |
2.88% |
|
TLS |
Telstra Corp Ltd |
Telecommunication Services |
4.80% |
3.50% |
-1.30% |
|
LEI |
Leighton Holdings |
Industrials |
0.20% |
3.00% |
2.80% |
|
MQG |
Macquarie Grp Ltd |
Financials |
1.31% |
4.50% |
3.19% |
|
TOL |
Toll Hldgs Ltd |
Industrials |
0.30% |
5.00% |
4.70% |
|
STO |
Santos Limited |
Energy |
1.09% |
5.00% |
3.91% |
|
CTX |
Caltex Australia |
Energy |
0.19% |
4.00% |
3.81% |
|
CPU |
Computershare Ltd |
Information Technology |
0.40% |
3.00% |
2.60% |
|
QBE |
QBE Ins Group |
Financials |
1.37% |
5.00% |
3.63% |
|
SHL |
Sonic Healthcare |
Health Care |
0.48% |
3.50% |
3.02% |
|
LLC |
Lend Lease Group |
Financials |
0.42% |
3.00% |
2.58% |
|
NCM |
Newcrest Mining |
Materials |
0.63% |
3.00% |
2.37% |
|
TEN |
Ten Network Hldgs |
Consumer Discretionary |
0.03% |
3.00% |
2.97% |
|
SIP |
Sigma Pharma |
Health Care |
0.05% |
3.00% |
2.95% |
|
AGO |
Atlas Iron Limited |
Materials |
0.06% |
3.00% |
2.94% |
Identifying our favoured stocks, we compare valuation metrics against the index. We find that our portfolio, on average, enjoys a higher expected growth rate to the index. While the ASX200 index is expected to grow earnings on average by 6.1%, the stocks in our portfolio collectively are expected to grow earnings by 10.4%, thanks to holdings in Macquarie Group (market expects 21% EPS growth next year), Newcrest (53%) and Rio Tinto (11%). Our portfolio also shows more value investing than the index, with the ASX200 PE ratio of 15.3 times compared with our portfolio average PE ratio of 14.1 times. This reflects our hunt for stocks with lower than market average PE ratios, something our regular readers will notice. The earnings growth and low PE also naturally culminate to produce a portfolio expected return on equity (15.9%) in excess of the expected ASX200 return on equity of 14.2%. This is not to say that the ASX200 is expected to return 14%, it is to say that on average, the companies that make up the ASX200 are expected to generate 14.2% return on shareholders’ equity. This is also indicative that our portfolio seeks the higher returning stocks of the ASX200, leading to outperformance. However, with the apparent value in our portfolio, it does come at the expense of yield. While the ASX 200 forward dividend yield is 4.2%, our portfolio yield is only 3.3%, indicating the growth nature of the stocks we are owning. With most income stocks, which inflate the ASX 200 average yield, being mature companies with high payout ratios, we have chosen companies that have mostly adopted lower payout ratios, as they fund growth internally.
Figure 1 Portfolio characteristics (Source: Fairmont Equities, State Street)
|
|
ASX200 |
Portfolio |
|
Est. 3-5 Year EPS Growth |
6.16% |
10.40% |
|
Dividend Yield |
4.23% |
3.35% |
|
Fiscal Year 1 Price/Earnings |
15.34 |
14.11 |
|
Return on Equity |
14.25% |
15.92% |
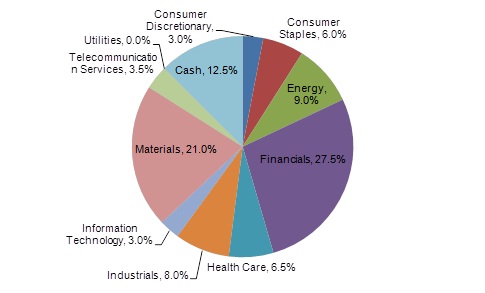
Looking at the sector composition of the FE200 model portfolio, it is well diversified by sector. With the largest industries on the index being Financials and Materials, we have balanced our exposure to both industries, keeping them largely similar in weight, with Materials making 21% of our portfolio value and Financials 28%. We also have small, diversified exposure to every other sector covered in the ASX 200.
As we find opportunities for stocks with good returns, or we identify industries with bright horizons, our sector exposures will change. We will also continually use our skills in technical analysis to ensure that we are making changes at the right time in order to give ourselves an edge.