If you remember back to the middle of 2012, there were many issues that were concerning investors. We had unsustainable borrowing costs in Spain and Italy, threats of Greece leaving the Euro, anaemic growth in the US, and falling growth in China. You would have noticed that markets were edging up on low volume, and mainly in the “safer” stocks, because risk appetite was still very low, which means another dip down was a strong possibility.
Investors into safe stocks did so not because the company itself had increased prospects, but purely because the alternative, term deposits, was becoming unattractive. With the ECB having brokered a deal to get borrowing costs coming down in Europe and the economies of US and China recovering, we now in hindsight have a situation where we can justify the current rally. It brings out those who base investment strategies on throw-away lines of Warren Buffett such as "attempt to be fearful when others are greedy and to be greedy only when others are fearful" Sounds good in theory when you are taking a punt, not investing your life savings, because “In the business world, the rearview mirror is always clearer than the windshield” and it doesn’t hurt to obey the following rules "Rule No. 1: Never lose money. Rule No.2: Never forget rule No.1". It seems as though there is a Warren Buffet quote for every occasion. It is said that people often make irrational decisions and then try to rationalise their actions later. Well if some of last year’s rally seemed irrational, we now need to see improved company earnings to rationalise it.
You really shouldn’t be concerned that the market has gone up the last few months if you still have some spare cash. Because you cannot identify a bottom until it has already occurred. As soon as you use that information to project what is likely in the weeks or months ahead, a more fascinating picture emerges. If the scary, low volume defensive rally that started last year is actually the beginning of a bigger move, then we can use this lower risk environment to springboard up to something greater. Suppose that we are emerging out of a bear market for equities. Remember, the average length of bear markets is around 5 years, and we have now surpassed that. If you look back to the beginning of the last bull market in 2003, we can start to see some similarities.
In the chart below (all charts on a weekly basis), I have plotted the performance of the S&P/ASX 200 (XJO) in relation to the Telecommunications sector (XTF) [gold] ,the Financials Index (XFJ) [blue], the Materials Index (XMJ) [red],and the Energy sector (XEJ) [green]. With the XJO in black, you can see how each sector has performed since the market “bottomed” last year.
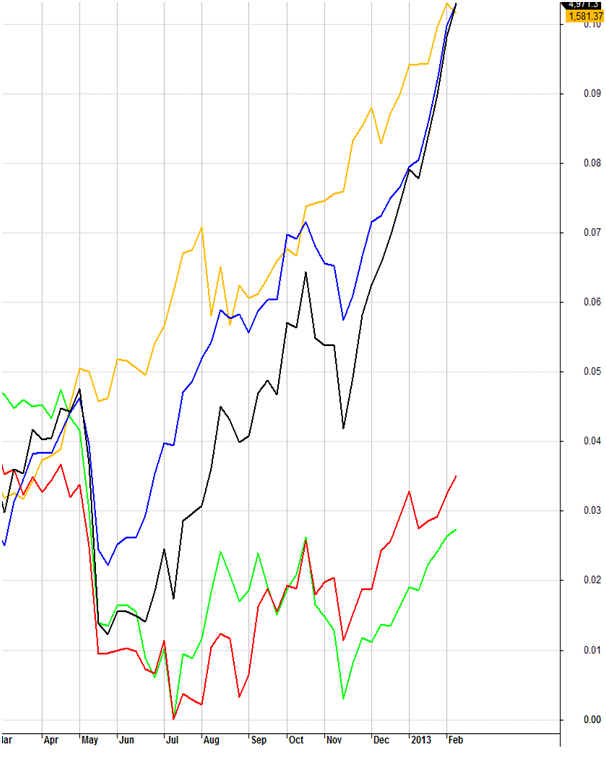
The chart shows what feels to have happened. For simplicity I have not used every sector, but we can see that Telecommunications (Telstra) and the Banks have led the market higher. That is plain to see. Materials and Energy have massively underperformed during this time. You might find yourself thinking that the materials and energy sector are in trouble and you’d be right in assuming that this is not the case. If you were to look back at how investors reacted to the start of a bull market in 2003, you will see some similarities.
The chart below shows the progress of the market from the 2003 low for a nearly a year and a half. The colours remain the same.
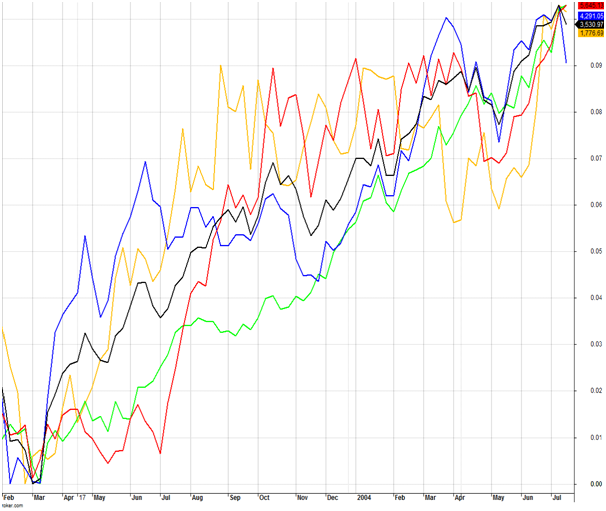
You will notice that a few months in to the rally, Telecommunications and Financials have led the index higher while Materials and Energy lag behind, to the point where the chart looks almost the same as the current situation. The only difference is this time we have taken a few more months to reach this point, perhaps due to Christmas volumes, etc.
We then reach a point where 3 noticeable changes happen. The Financials index takes a breather and undergoes a 5 month correction, the Energy index starts to rally a bit more, and the Materials index explodes. This is consistent with the theory that the first movers are the safer large cap stocks, then a rotation starts to occur towards the “riskier” sectors. As you can see, the movement of the “riskier” stocks, in this case the materials sector, can more than make up for the recent movement in Financials. Sooner or later, the investment in this sector overtakes the value passively held Financials or the overall market.
The world is a different place compared to 10 years ago, so you don’t trade the same stocks per se, but you look at the sectors and the idea of investor’s natural tendencies to manage risk. When you realise that investors go through the same motions (or emotions), then your understandings will improve. Lets have a look at different market caps as a proxy for investor risk. That is, big cap stocks are “safer” than small cap stocks”.
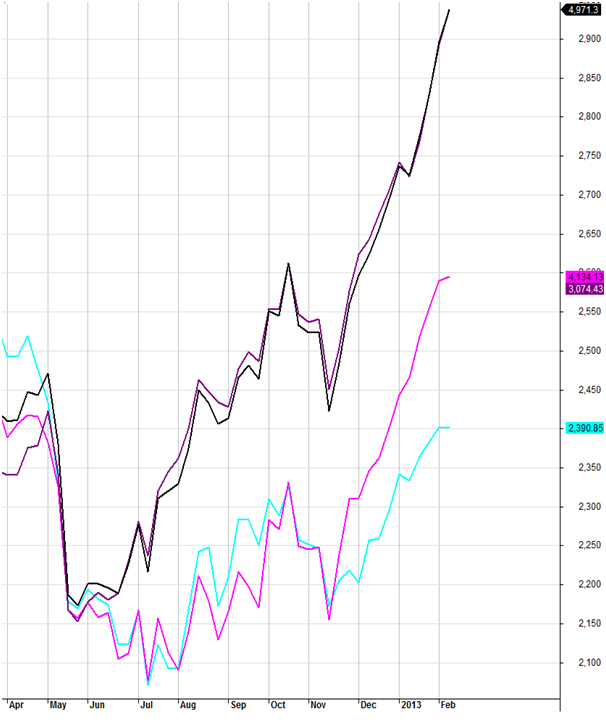
Below is a chart of the XJO (in black), compared to the top 20 (XTL) [purple], the Midcap 50 (XMD) [pink], and the Small Ordinaries (XSO) [light blue]. It confirms the theory in that the top 20 stocks are leading the index, with the mid and smaller stocks lagging behind. You will notice that the mid cap stocks increased their gradient in November. As the market had been going up for a few months, and overseas issues started evaporating (or being kicked down the road), and sentiment improved, the mid cap stocks started being bought. Smaller caps are now starting to show life also.
What normally happens from this point? Looking back at the last bull market in 2003 provides a predictable set or circumstances.
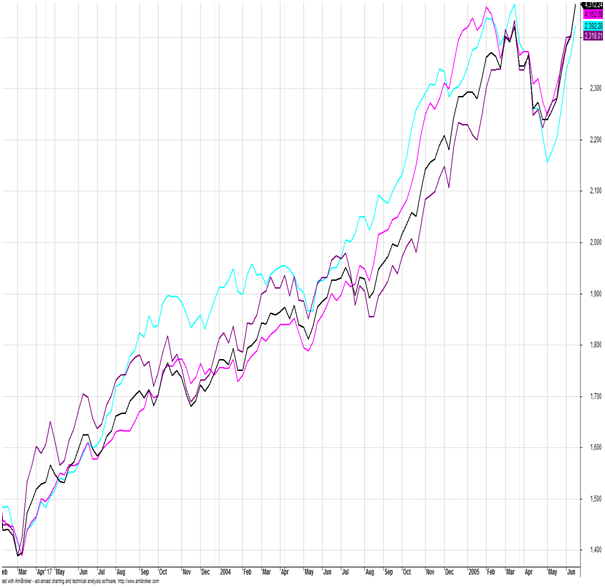
The initial move is the same as what we are seeing now with the big cap stocks leading the market. Then nearly 18 months into the rally, the top 20 stocks started underperforming the market, while the small and mid cap stocks were outperforming.
Its a good thing that we have observed this similarity. We can continue holding the current performers to the point where the next lot starts to perform even better. Whether that is an industry sector, a sector by market cap, or preferably both.
What would it be like if you could use this knowledge to your advantage? And we can start looking for trend changes? The Dow Jones is only 1% away from its all time highs. If we were to head to our pre-GFC level, it would represent a rally of over 1800 points, or 37%. So if we are starting a new bull market, then there is much more upside potential. And if this is a new bull market, it means that we are not only going to our old high, but we are going to surpass it. A rally of 37% sounds like a lot, but if we can rotate part of our holdings into the next up and coming sector, we could do better. The energy index in comparison will rally 53% to reach the pre-GFC high. Below is a chart of the XEJ, which is an example of a sector that I think can outperform.
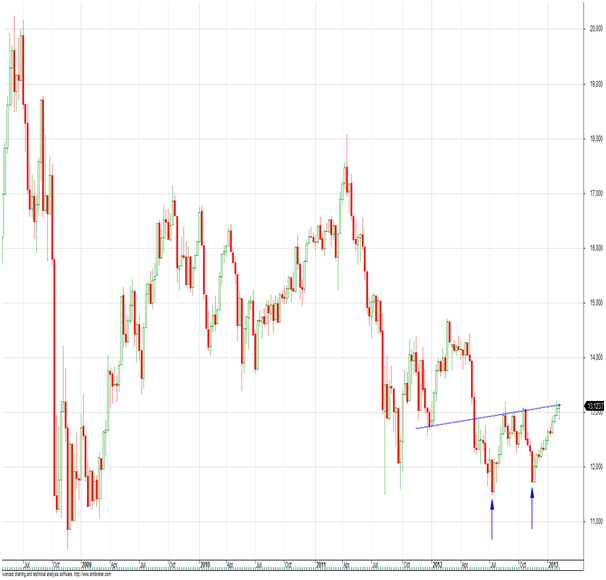
Oil has gone to its highest level in 9 months yet the energy stocks have moved sideways. Fear of the US suddenly flooding the market with cheap oil has been overstated. Punching through this key resistance level (indicated by the blue dotted line), now that it has formed a double bottom (indicated by the arrows) means that 2013 should be a good year for energy stocks. Not to mention the other sectors, and not to mention the potential of other good quality companies outside the top 20. It means that if we can manage this intra-market rotation, sooner or later those little gains should start to add up to an outperformance.